Powerful Monitoring of Cloud Applications With Amazon Cloudwatch

Amazon CloudWatch
Amazon CloudWatch is a service for monitoring and observing AWS resources in real time. Modern applications based on AWS services such as Amazon Elastic Compute Cloud (EC2) and AWS Lambda automatically generate a lot of data like metrics, logs or events. In addition, custom metrics from your own applications and services can also be published.
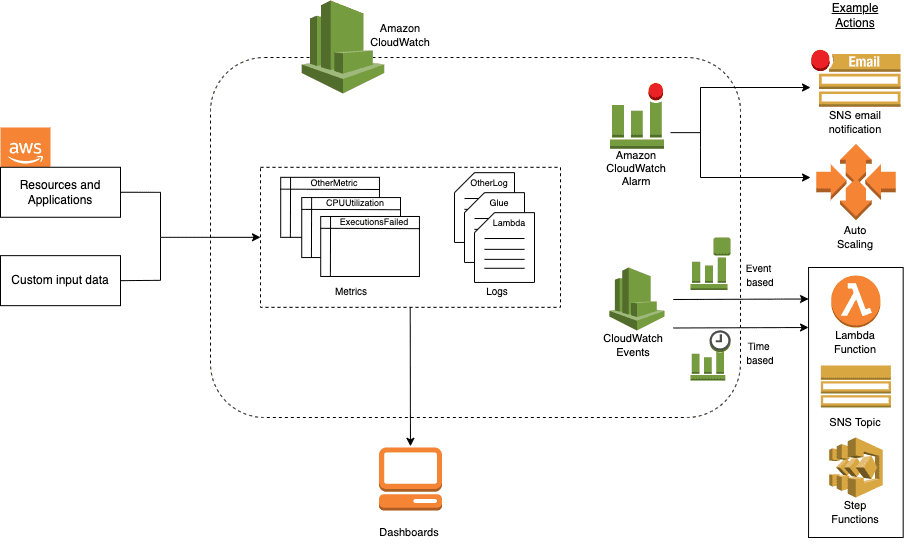
All this data is captured on a central platform with Amazon CloudWatch. Here, the collected metrics and events can be used to:
- visualize collected data and provide insight into performance and utilization of AWS resources
- define alarms that execute actions when certain events occur
- create logs, e. g. to help finding and fixing sources of errors
- respond to events and achieving a higher level of automation

The figure shows a rough overview of Amazon CloudWatch’s functionality and use cases.
Dashboards
Dashboards are used to visualize metrics from AWS resources and custom metrics. The dashboards are dynamically updated to reflect the latest performance metrics. The shown time period can range from one minute up to 15 months.
Via the Amazon CloudWatch web interface, automatic dashboards can be created that visualize the observed metrics in the form of graphs. For example, an automated dashboard for AWS Lambda generates a line graph for each of the metrics Invocations, Duration, Errors, and Throttles and maps all Lambda Functions to the graphs.
In addition to the automatically generated dashboards, completely customizable dashboards can also be created. This makes only the data that is relevant to you directly visible at a glance.

This example shows a simple custom dashboard for some metrics of a State Machine (AWS Step Functions). On the left side, the ExecutionsFailed and ExecutionsSucceeded metrics are shown in the form of a pie chart, while on the right side, the ExecutionTime metric is shown in the form of a line chart.
Alarms and Actions
Another feature of Amazon CloudWatch are Alarms. A CloudWatch alarm can perform one or more automated actions when a selected metric reaches or exceeds/falls below a specified threshold.
An example for the use of an alarm is the Amazon API Gateway service. API Gateway provides various metrics for your own APIs, such as latencies or the number of responses with 4xx or 5xx HTTP status codes. An alarm can now be created for these metrics by selecting a metric and defining a condition to trigger the alarm. For example, for the metric of sent responses with 5xx-HTTP status codes, the condition could be that the number of such responses has reached or exceeded a threshold of 20 in the last 5 minutes. After that, actions can be configured which will be executed by the Alarm. One action could be sending an email notification to a given email address.
Amazon CloudWatch Alarms can also be used to optimize the utilization of AWS resources to save operational costs. Instances of Amazon EC2 provide various metrics, including the metric CPUUtilization. For example, an Alarm for the metric CPUUtilization could be activated when utilization falls below a threshold of 30%. Auto Scaling can be selected as an action to remove the low utilized EC2 instance from a server group. Likewise, an alarm can also be defined in the event that an EC2 instance exceeds a threshold with its CPU utilization. Auto Scaling could then be used to add another instance to better distribute the workload.
Logs
Amazon CloudWatch Logs is another section of Amazon CloudWatch and is used to store and monitor logs that come from various sources such as Amazon EC2, AWS Lambda and Amazon Elastic Container Service (ECS). The various logs are located in so-called Log Groups and are sorted by a timestamp, which makes searching for specific logs very easy.
Some other features of Amazon CloudWatch Logs include:
- real-time monitoring of applications and systems: Logs can be monitored in near real-time for specific expressions. This allows, for example, an alarm to be triggered when the number of errors found in the logs exceeds a certain threshold
- the retention of logs: By default, logs are retained indefinitely. For Log Groups, however, it is also possible to specify individually after what period the logs should be deleted automatically
In addition, data queries can be performed on the logs via CloudWatch Logs Insights, which is a fully integrated feature in Amazon CloudWatch. A special query language is used for CloudWatch Logs Insights, which provides some simple but powerful query commands. The queries here include aggregations, filters, regular expressions and text searches. Additionally, visualizations can be generated based on trends and patterns that appear in the logs over time. These visualizations can also be placed in dashboards.
Events
Another process automation feature is Amazon CloudWatch Events. This is an event stream that can be used to describe changes in AWS resources in near real-time. Simple declarative rules can be defined to match events and perform one or more actions.
A rule has an event source. This can be an event pattern, such as a change in the execution state of a State Machine, or be triggered by a schedule. When a suitable event occurs, the actions associated with the rule are executed. These include executing a Lamdba Function, starting or stopping EC2 instances, and sending push notifications via Amazon Simple Notification Service (SNS).
Summary
Amazon CloudWatch, as an AWS service, provides a comprehensive and centralized platform for monitoring AWS resources and custom application data. Thanks to automatically generated data from other AWS services and the ability to publish your own metrics, insight into performance and utilization of developed applications is quick and easy.
With a high level of automation, the performance and resource usage of your applications can be managed and optimized. In addition, insights can be gained from viewable logs that can be used to quickly locate and fix sources of errors.
How do you monitor resources and applications in use and which software solutions do you use for this?


